---
title: How to Access and Interpret Your Explore Usage Dashboard
description: The usage dashboard provides statistical data on how your user engage with Explore.
---
[Skip to content](https://support.informit.org/knowledge-base/informit-explore-1#main-content)
English
Show submenu for translations
[Contact us for more support?](https://support.informit.org/knowledge-base/kb-tickets/new?hsLang=en)
[](https://support.informit.org/migration/knowledge-base?hsLang=en)
- [Go to search.informit.org](https://search.informit.org/)
Open main navigation
Close main navigation
- [Go to search.informit.org](https://search.informit.org/)
- English
Show submenu for translations
- [Contact us for more support?](https://support.informit.org/knowledge-base/kb-tickets/new)
- [Go to search.informit.org](https://search.informit.org/)
[Go to search.informit.org](https://search.informit.org/)
How can we help you today?
- There are no suggestions because the search field is empty.
1. [Informit Knowledge Base](https://support.informit.org/knowledge-base?hsLang=en)
2. [Informit Explore](https://support.informit.org/knowledge-base/informit-explore?hsLang=en)
3. [Explore Administrator tools](https://support.informit.org/knowledge-base/informit-explore?hsLang=en#explore-administrator-tools)
March 19, 2026
# How to Access and Interpret Your Explore Usage Dashboard
## The usage dashboard provides statistical data on how your user engage with Explore.
Analysing usage across your cohort will help you get the most out of your subscription by providing valuable insights on how your students, teachers and patrons are interacting with Explore and potentially highlighting areas where additional training could be provided to encourage further usage.
Whether tracking Explore logins, page views and downloads, or engagement with Explore’s curated subjects and issues, the Explore Usage Dashboard is the central place to find this information.
### **Accessing your dashboard**
This guide will walk you through the steps to access your usage dashboard quickly and easily.
**Step 1: Login as an administrator**
- To view the Explore Usage Dashboard, you need to be logged in as an administrator. If you have not already done so, you will need to register. You can find guidelines on how to do that [here.](https://support.informit.org/knowledge-base/administrator-access?hsLang=en)
- To login, click **Log in | Registe**r at the top right corner of your screen. When prompted select the **INDIVIDUAL LOGIN | REGISTER** button and enter your details.
**Step 2: Access your Usage Report via your Administrator Account**
- Once logged in, click on your username on the top right corner and select **My Account**. You will then be taken to your Administrator Account. On the left-hand side menu of your screen under **INSTITUTIONAL ACCOUNT**, you will see a menu item that reads **Usage Reports**. Click on that and you will be taken to an overview of all Informit usage reports.
**Step 3: Access your Explore Usage Dashboard**
- From here, select **EXPLORE USAGE**

### **Understanding your dashboard**
The Explore Usage Dashboard is divided into several key sections. This guide will briefly outline what each section aims to demonstrate. On each graph, you can click the ‘i’ button located next to the title for further information about what the graph shows.
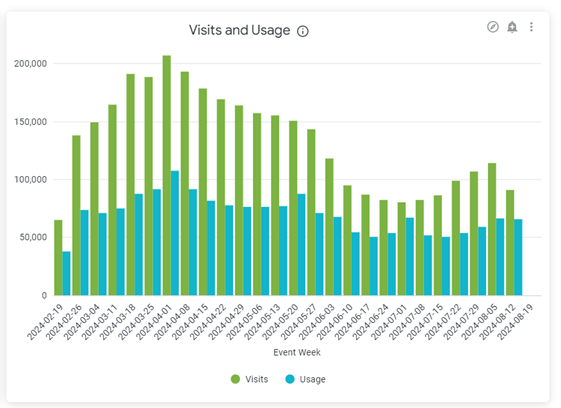
**Visits and Usage**
The Visits and Usage graph displays a high-level overview of Explore access at your library. Visits includes the number of times a user logged in to Explore. Usage, meanwhile, incorporates both views and downloads of article and media content on Explore.
**Usage by Publication**
The Usage by Publication graph provides a list of the most popular publications based on the number of times a publication was accessed. All content across informit is included in this data, regardless of whether it was retrieved from a search query, or a subject or issue page.
**Usage by Item**
The Usage by Item graph provides a list of the most popular items on Informit Explore based on the number of times an item was accessed or downloaded. This includes any type of resource accessible on Informit, including journal articles, book chapters, reports, conference papers, media and more.
All content across informit is included in this data, regardless of whether it was retrieved from a search query, or a subject or issue page. In the graph, you can also see what publication the item was published in.
For a media specific breakdown, please view the TVNews or EduTV reports avaliable on Insights.

**Changing the Date and Time**
As a default, the data you see in each graph covers a period of 180 days. You can change the date and timeframe to a number of different options. Simply navigate to the **Filter** icon on the top right corner of the page. Once you click this, you’ll be presented with a **Period** filter. Click on the current date and time (i.e Last 180 Days). This will open up a drop-down menu with plenty of options to choose from.
### Feedback and Development
The Explore Usage Dashboard is currently in live beta and will undergo further development and enhancements. Only data that has been fully validated and confirmed for accuracy has been included in this stage. Further reporting metrics and graphs are in active development and will be added to the dashboard once they are completed.
We welcome your feedback on any aspect of product usage you are curious about that is not currently covered on the dashboard. Please complete [this form](https://share.hsforms.com/1mlH1rqyaSoq1r9pZ6yOVpQ3hdl4), if you would like to participate in the feedback process, or email **Jessica.Darnell@rmit.edu.au** directly.
### Coming soon:
- Search Terms: A graph that displays the top 50 most popular search terms at your institution
- Statistics on issue page clicks and summary of the most popular subjects and issues at your institution: Once issues are available as searchable records on Informit, we will be able to provide data on how often your users are accessing them
- [Informit](https://support.informit.org/knowledge-base/informit?hsLang=en#main-content)
- [Authentication](https://support.informit.org/knowledge-base/informit?hsLang=en#authentication)
- [Content Updates and Announcements](https://support.informit.org/knowledge-base/informit?hsLang=en#content-updates-and-announcements)
- [Platform Search Strategies](https://support.informit.org/knowledge-base/informit?hsLang=en#platform-search-strategies)
- [Core Training and Education resources](https://support.informit.org/knowledge-base/informit?hsLang=en#core-training-and-education-resources)
- [Core Administrator tools](https://support.informit.org/knowledge-base/informit?hsLang=en#core-administrator-tools)
- [Informit Explore](https://support.informit.org/knowledge-base/informit-explore?hsLang=en#main-content)
- [Explore Authentication](https://support.informit.org/knowledge-base/informit-explore?hsLang=en#explore-authentication)
- [Explore Content Updates and Announcements](https://support.informit.org/knowledge-base/informit-explore?hsLang=en#explore-content-updates-and-announcements)
- [Explore Search and Navigation](https://support.informit.org/knowledge-base/informit-explore?hsLang=en#explore-search-and-navigation)
- [Explore Training and Education resources](https://support.informit.org/knowledge-base/informit-explore?hsLang=en#explore-training-and-education-resources)
- [Explore Administrator tools](https://support.informit.org/knowledge-base/informit-explore?hsLang=en#explore-administrator-tools)
- [Publishing & Partners](https://support.informit.org/knowledge-base/publishing-partners?hsLang=en#main-content)
- [Partner Dashboard](https://support.informit.org/knowledge-base/publishing-partners?hsLang=en#partner-dashboard)
- [Publisher Resources](https://support.informit.org/knowledge-base/publishing-partners?hsLang=en#publisher-resources)
[](https://search.informit.org/)
[Start your search with Informit.org](https://search.informit.org/)
[About Informit](https://about.informit.org/)
Copyright © 2025, Informit
Melbourne, Australia
```json
{
"@context" : "https://schema.org",
"@type" : "VideoObject",
"contentUrl" : "https://5849608.fs1.hubspotusercontent-na1.net/hubfs/5849608/Explore%20Insights%20Dashboard.mp4",
"dateModified" : "2024-09-09T00:12:35.347Z",
"duration" : "PT2M17S",
"height" : 1080,
"name" : "Explore Insights Dashboard",
"thumbnailUrl" : "https://5849608.fs1.hubspotusercontent-na1.net/hubfs/5849608/Explore%20Insights%20Dashboard.mp4/medium.jpg",
"uploadDate" : "2024-09-09T00:12:35.342Z",
"width" : 1920
}
```